Indicators
-
Affordability
-
Environmental Burden
-
Health
-
Economy
-
Education
-
Voter Participation
-
Parks & Trails
-
Development Practices
-
Agricultural Practices
-
Tree Canopy
-
Wetland Change
-
Wildlife Diversity
-
Nutrients
-
Sediment
-
Bacteria
-
Aquatic Life
-
Demand
-
Flooding
-
Overall
-
Community
-
Land
-
Water
| Number | Region Name | Affordability | Color | Environmental Burden | Color | Health | Color | Economy | Color | Education | Color | Voter Partcipation | Color | Community | Color | Parks & Trails | Color | Development Practices | Color | Agricultural Practices | Color | Tree Canopy | Color | Wetland Change | Color | Wildlife Diversity | Color | Land | Color | Nutrients | Color | Sediment | Color | Bacteria | Color | Aquatic Life | Color | Demand | Color | Flooding | Color | Water | Color | Overall | Color |
|---|---|---|---|---|---|---|---|---|---|---|---|---|---|---|---|---|---|---|---|---|---|---|---|---|---|---|---|---|---|---|---|---|---|---|---|---|---|---|---|---|---|---|---|---|---|
| ALL | White River Watershed | C | #ffcc77 | D | #F37024 | C | #ffcc77 | C+ | #ffd999 | B | #6FB344 | C- | #FDBD48 | C | #ffcc77 | C | #ffcc77 | C+ | #ffd999 | C+ | #ffd999 | D | #F37024 | F | #B0442E | B- | #a4b743 | C | #ffcc77 | C+ | #ffd999 | B- | #a4b743 | D | #F37024 | B- | #a4b743 | U | #A4A5A8 | U | #A4A5A8 | C | #ffcc77 | C | #ffcc77 |
| 09 | Clear, Lambs, Indian, & Butler Creeks | C+ | #ffd999 | C | #ffcc77 | B- | #a4b743 | C+ | #ffd999 | B | #6FB344 | B | #6FB344 | B- | #a4b743 | B- | #a4b743 | B | #6FB344 | C+ | #ffd999 | C- | #FDBD48 | F | #B0442E | B- | #a4b743 | C | #ffcc77 | C- | #FDBD48 | D+ | #f6892d | F | #B0442E | B- | #a4b743 | U | #A4A5A8 | U | #A4A5A8 | D+ | #f6892d | C | #ffcc77 |
| 08 | White Lick Creek | C | #ffcc77 | D | #F37024 | B- | #a4b743 | B- | #a4b743 | B+ | #68a446 | B- | #a4b743 | C+ | #ffd999 | C | #ffcc77 | C | #ffcc77 | C+ | #ffd999 | B- | #a4b743 | F | #B0442E | B | #6FB344 | C | #ffcc77 | B- | #a4b743 | C | #ffcc77 | D- | #d95f2a | B | #6FB344 | U | #A4A5A8 | U | #A4A5A8 | C | #ffcc77 | C | #ffcc77 |
| 07 | Eagle Creek & Eagle Creek Reservoir | C | #ffcc77 | F | #B0442E | C | #ffcc77 | C | #ffcc77 | C+ | #ffd999 | D- | #d95f2a | C- | #FDBD48 | B- | #a4b743 | C+ | #ffd999 | B- | #a4b743 | D+ | #f6892d | F | #B0442E | B+ | #68a446 | C | #ffcc77 | B | #6FB344 | A- | #649849 | C | #ffcc77 | U | #A4A5A8 | U | #A4A5A8 | U | #A4A5A8 | B | #6FB344 | C | #ffcc77 |
| 06 | Lower Fall Creek & Pleasant Run | C | #ffcc77 | F | #B0442E | C- | #FDBD48 | C | #ffcc77 | D+ | #f6892d | F | #B0442E | D | #F37024 | C | #ffcc77 | C | #ffcc77 | U | #A4A5A8 | F | #B0442E | F | #B0442E | B | #6FB344 | D+ | #f6892d | A- | #649849 | B- | #a4b743 | D- | #d95f2a | B- | #a4b743 | U | #A4A5A8 | U | #A4A5A8 | C+ | #ffd999 | C- | #FDBD48 |
| 05 | Cicero Creek & Morse Reservoir | C | #ffcc77 | C+ | #ffd999 | C+ | #ffd999 | B- | #a4b743 | A | #5F8C4C | A | #5F8C4C | B | #6FB344 | C | #ffcc77 | B- | #a4b743 | C | #ffcc77 | F | #B0442E | D | #F37024 | D+ | #f6892d | C- | #FDBD48 | C | #ffcc77 | B | #6FB344 | C- | #FDBD48 | C | #ffcc77 | U | #A4A5A8 | U | #A4A5A8 | C+ | #ffd999 | C | #ffcc77 |
| 04 | Stony & Crooked Creeks | C | #ffcc77 | D+ | #f6892d | C+ | #ffd999 | C+ | #ffd999 | A | #5F8C4C | A- | #649849 | B- | #a4b743 | B- | #a4b743 | C | #ffcc77 | C+ | #ffd999 | F | #B0442E | F | #B0442E | B | #6FB344 | C- | #FDBD48 | D+ | #f6892d | B | #6FB344 | C- | #FDBD48 | B- | #a4b743 | U | #A4A5A8 | U | #A4A5A8 | C | #ffcc77 | C- | #FDBD48 |
| 03 | Upper Fall Creek & Geist Reservoir | C | #ffcc77 | C- | #FDBD48 | C | #ffcc77 | B- | #a4b743 | A- | #649849 | B | #6FB344 | B- | #a4b743 | D | #F37024 | C+ | #ffd999 | C+ | #ffd999 | D | #F37024 | D | #F37024 | C | #ffcc77 | D+ | #f6892d | B | #6FB344 | C | #ffcc77 | C- | #FDBD48 | C | #ffcc77 | U | #A4A5A8 | U | #A4A5A8 | C | #ffcc77 | C | #ffcc77 |
| 02 | Killbuck, Pipe, & Duck Creeks | B- | #a4b743 | F | #B0442E | D | #F37024 | C | #ffcc77 | C+ | #ffd999 | F | #B0442E | D+ | #f6892d | D | #F37024 | C | #ffcc77 | C+ | #ffd999 | D | #F37024 | D | #F37024 | C+ | #ffd999 | C- | #FDBD48 | C+ | #ffd999 | B | #6FB344 | D+ | #f6892d | B+ | #68a446 | U | #A4A5A8 | U | #A4A5A8 | C+ | #ffd999 | C | #ffcc77 |
| 01 | Headwaters & Prairie Creek Reservoir | D+ | #f6892d | D | #F37024 | C- | #FDBD48 | C- | #FDBD48 | B | #6FB344 | F | #B0442E | D+ | #f6892d | C | #ffcc77 | C | #ffcc77 | B- | #a4b743 | C- | #FDBD48 | D | #F37024 | C | #ffcc77 | C- | #FDBD48 | B | #6FB344 | C+ | #ffd999 | D+ | #f6892d | B | #6FB344 | U | #A4A5A8 | U | #A4A5A8 | C+ | #ffd999 | C | #ffcc77 |
The Community category evaluates the human facets of the watershed through the following indicators:
• Affordability
• Environmental Burden
• Health
• Economy
• Education
• Voter Participation
The Land category evaluates the natural and built environment of the watershed through the following indicators:
• Parks & Trails
• Development Practices
• Agricultural Practices
• Tree Canopy
• Wetland Change
• Wildlife Diversity
The Water category evaluates the quality and quantity of the river and its tributaries through the following indicators:
• Nutrients
• Sediment
• Bacteria
• Aquatic Life
• Demand
• Flooding
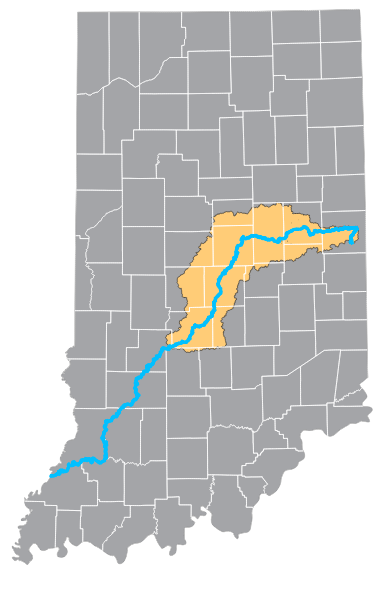
Overall, the White River watershed has a moderate health score of 51%, a C. This grade is a composite of three broad indicator categories, COMMUNITY, LAND, and WATER, each of which has a moderate C score. These three categories are each made up of six indicators which provide grades at a more detailed level, which you can explore by clicking each of the indicator icons. These indicators have also been evaluated individually within nine regions of the White River watershed, which you can explore by clicking the regions.
Was not graded due to insufficient historical data. It is intended to evaluate flooding frequency based on peak rainfall events and runoff coefficients calculated by land cover type. This indicator will be graded in future report card updates.
Was not graded due to insufficient regional data. It is intended to evaluate water use per capita and/or water supply and demand by region.
Evaluates the fish community and in-stream habitat quality of the waterway.
Data sources: Indiana Department of Environmental Management, Muncie Bureau of Water Quality
Note: Eagle Creek & Eagle Creek Reservoir region was not graded as community fish data was not collected for this area.
Evaluates the concentration and frequency of E.coli exceeding threshold (235 CFU/ 100mL) in the waterway.
Data sources: Indiana Department of Environmental Management, Muncie Bureau of Water Quality, Marion County Public Health Department, Indianapolis Department of Public Works
Evaluates the frequency of Total Suspended Solids exceeding threshold (25 mg/L) in the waterway.
Data sources: Indiana Department of Environmental Management, Muncie Bureau of Water Quality, Marion County Public Health Department
Evaluates the median concentration of Nitrogen as Nitrate + Nitrate (N+N as N) and Total Phosphorus in the waterway.
Data sources: Indiana Department of Environmental Management, Muncie Bureau of Water Quality, Marion County Public Health Department
Evaluates the presence of wildlife indicator species.
Data sources: DNR Indiana Natural Heritage Data, Global Biodiversity Information Facility
Evaluates the percent change in wetland area (from 2005 to 2019).
Data source: National Wetlands Inventory (NWI) and USGS National Land Cover Database
Evaluates the percent change in tree canopy cover (from 2011 to 2019).
Data source: USGS National Land Cover Database
Evaluates the percent of farmland using Best Management Practices of cover crops and minimum or no tillage.
Data source: USDA National Agricultural Statistics Service (NASS) Cropland data, Indiana Conservation Partnership
Note: Not sufficient data to grade Lower Fall Creek & Pleasant Run region as data is not collected in Marion County.
Evaluates the precent of properties with flood damage risk, precent of floodplain developed, and acres of development per person.
Data sources: FloodFactor, USGS National Land Cover Database, US Census Bureau
Evaluates the number of people per park, park acreage per person, and miles of trail per 1,000 residents.
Data sources: US Census Bureau, Indiana Department of Natural Resources, Trust for Public Land ParkServe, various county-level GIS files
Evaluates percent of non-incarcerated voting-age population who cast a presidential vote in 2020.
Data source: Redistricting Data Hub
Evaluates the precent of the population 25 or older with at least a high school diploma or equivalent.
Data source: US Census Bureau
Evaluates the estimated unemployment rate for the labor force over age 16, population living below federal poverty line, and the annual change in Gross Domestic Product (aggregated per-capita).
Data sources: US Census Bureau, US Bureau of Labor Statistics, US Bureau of Economic Analysis
Evaluates the percent of population with health insurance coverage and the percent of population living in area with high burdens of chronic health conditions. Chronic health conditions include asthma, cancer, depression, diabetes, high blood pressure.
Data source: US Centers for Disease Control and Prevention
Evaluates a person’s potential exposure to environmental pollution based on population and the presence of air pollution, hazardous sites, transportation infrastructure, water pollution, and lead-based paint.
Data source: US Centers for Disease Control and Prevention Environmental Justice Index 2022
The amount of median household income spent on housing and transportation costs, and the percent of households paying more than 30% of income for housing.
Data sources: Center for Neighborhood Technology, US Census Bureau
This region encompasses the subwatersheds of Clear Creek, Lambs Creek, Indian Creek, and Butler Creek. It is home to Martinsville, Trafalgar, Bargersville, and Monrovia. In 2020 the population was 102,938, with 90% identifying as White, 2% as Black, 3% as Hispanic, and overall 11% as a person of color. The region is dominated by natural area (forest, wetland, water) which covers 47% of the land, while 40% is in agriculture, and 12% is developed.
Learn more about the region here.
This region encompasses the subwatershed of White Lick Creek. It is home to Avon, Plainfield, Brownsburg, and Danville. In 2020 the population was 202,062, with 79% identifying as White, 9% as Black, 6% as Hispanic, and overall 23% as a person of color. The region is dominated by agriculture covering 54% of the land, while 32% is developed, and 14% is natural (forest, wetland, water).
Learn more about the region here.
This region encompasses the subwatershed of Eagle Creek along with Eagle Creek Reservoir. It is home to Zionville, Speedway, Whitestown, and the northwestern portion of Indianapolis. In 2020 the population was 241,274, with 49% identifying as White, 29% as Black, 17% as Hispanic, and overall 53% as a person of color. The region is dominated by agriculture covering 50% of the land, while 38% is developed, and 12% is natural (forest, wetland, water).
Learn more about the region here.
This region encompasses the subwatersheds of Lower Fall Creek and Pleasant Run. It is home to Indianapolis, Lawrence, Beech Grove, Southport, and the northwestern half of Greenwood. In 2020 the population was 566,155, with 56% identifying as White, 24% as Black, 12% as Hispanic, and overall 46% as a person of color. The region is dominated by development on 82% of the land, while 11% is in agriculture, and 7% is natural (forest, wetland, water).
Learn more about the region here.
This region encompasses the subwatershed of Cicero Creek along with Morse Reservoir. It is home to Cicero, Tipton, Sheridan, and the northwest corner of Noblesville. In 2020 the population was 41,747, with 91% identifying as White, 1% as Black, 4% as Hispanic, and overall 10% as a person of color. The region is dominated by agriculture covering 82% of the land, while 11% is developed, and 7% is natural (forest, wetland, water).
Learn more about the region here.
This region encompasses the subwatersheds of Stoney Creek and Crooked Creek. It is home to Carmel, Noblesville, Fishers, Westfield, and the northern part of Indianapolis. In 2020 the population was 427,437, with 72% identifying as White, 12% as Black, 7% as Hispanic, and overall 29% as a person of color. The region is dominated by development on 52% of the land, while 39% is in agriculture, and 9% is natural (forest, wetland, water).
Learn more about the region here.
This region encompasses the subwatershed of Upper Fall Creek along with Geist Reservoir. It is home to Pendleton, McCordsville, Ingalls, and the southern half of Anderson. In 2020 the population was 99,326, with 82% identifying as White, 8% as Black, 4% as Hispanic, and overall 19% as a person of color. The region is dominated by agriculture which covers 68% of the land, while 20% is developed, and 12% is natural (forest, wetland, water).
Learn more about the region here.
This region encompasses the subwatersheds of Killbuck Creek, Pipe Creek, and Duck Creek. It is home to Elwood, Alexandria, Frankton, and the northern half of Anderson. In 2020 the population was 85,971, with 83% identifying as White, 8% as Black, 5% as Hispanic, and overall 18% as a person of color. The region is dominated by agriculture which covers 78% of the land, while 14% is developed, and 8% is natural (forest, wetland, water).
Learn more about the region here.
This region encompasses the subwatersheds of Buck Creek and Muncie Creek along with Prairie Creek Reservoir. It is home to Muncie, Yorktown, Winchester, and Daleville. In 2020 the population was 112,356 with 83% of the residents identifying as White, 7% as Black, 3% as Hispanic, and overall 17% as a person of color. The region is dominated by agriculture which covers 73% of the land, while 16% is developed, and 11% is natural (forest, wetland, water).
Learn more about the region here.