About the Report Card
The White River Report Card is an assessment and communication tool to measure community progress, align partners and activities, and inspire change that improves our river and its watershed and protects our economy and way of life.
Watershed report cards are assessment and communication tools that have been used around the world to compare ecological, social, and/or economic information against predefined goals or objectives. Similar to school report cards, watershed report cards provide performance-driven numeric and letter grades to effectively integrate and synthesize large, often complex, information into simple scores that can be communicated to decision makers and the general public to help guide community activity and public policies.
How was the Report Card Developed?
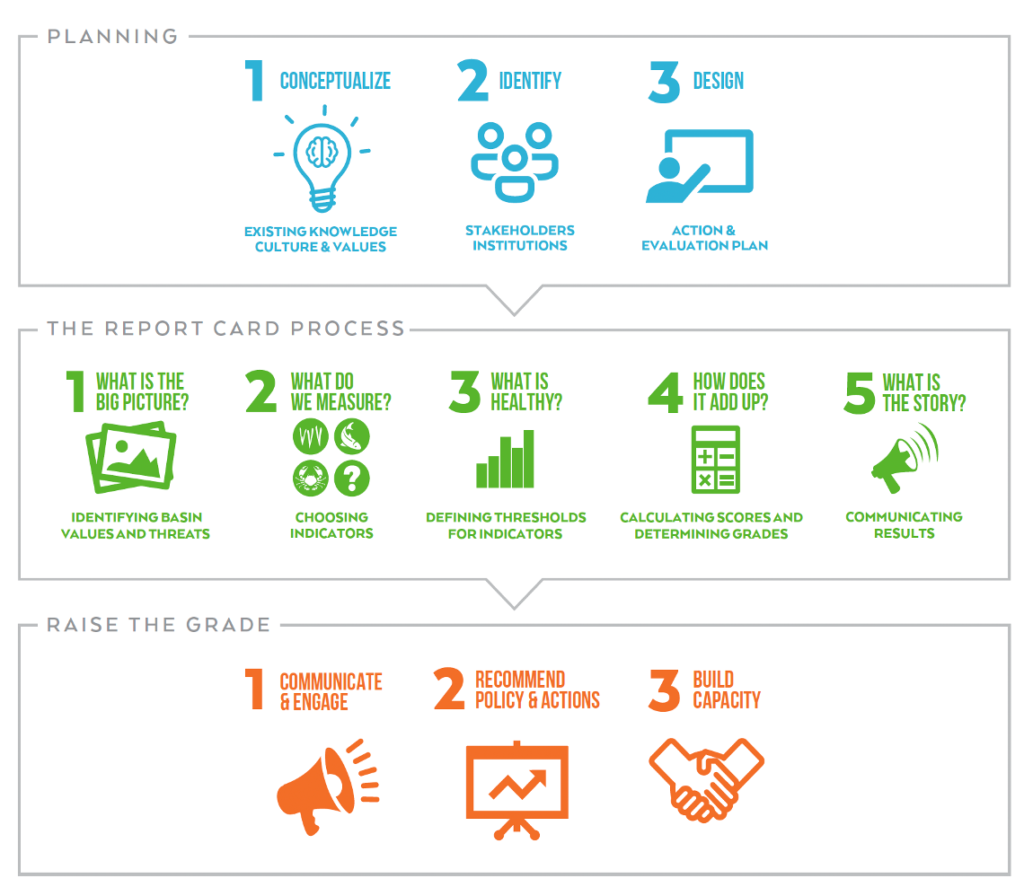
This first White River Report Card was created by following an extensive co-development process which involved over 200 stakeholders from the community, business, industry, government, agricultural, conservation, and utility sectors. In addition to being a natural ecosystem, humans use and depend on the river for lots of different things–drinking water, irrigation, recreation, drainage, industry, wastewater, and many more. The key to a report card’s success is including indicators that reflect as many different values and uses of the river. To do this we’re following a process perfected by our partners at the University of Maryland’s Center for Environmental Science.
The White River Report Card has completed the first two phases of the process and is now focused on Raising the Grade.
Learn more about improvement strategies here.
About the Watershed
White River flows in two forks across most of Central and Southern Indiana, creating the largest watershed contained entirely within the state. This Report Card is focused on the West Fork of White River and the surrounding land which is all part of the Upper White River Watershed. The Upper White River Watershed encompasses a 2,720 square mile area (1,740,544 acres) within central Indiana. It extends across sixteen (16) counties including significant portions of Hancock, Marion, Hendricks, Johnson, Hamilton, Morgan, Boone, Tipton, Madison, Henry, Delaware, and Randolph Counties, as well as smaller portions of Owen, Monroe, Brown, and Clinton Counties.
The White River begins in a farmer’s field in Randolph County, south of Winchester, and flows in a south western direction. As it travels the river passes through farms, woods, small towns, bustling cities, and industrial sites. These diverse land uses all influence the White River. Explore the White River and its watershed through the below interactive map!

